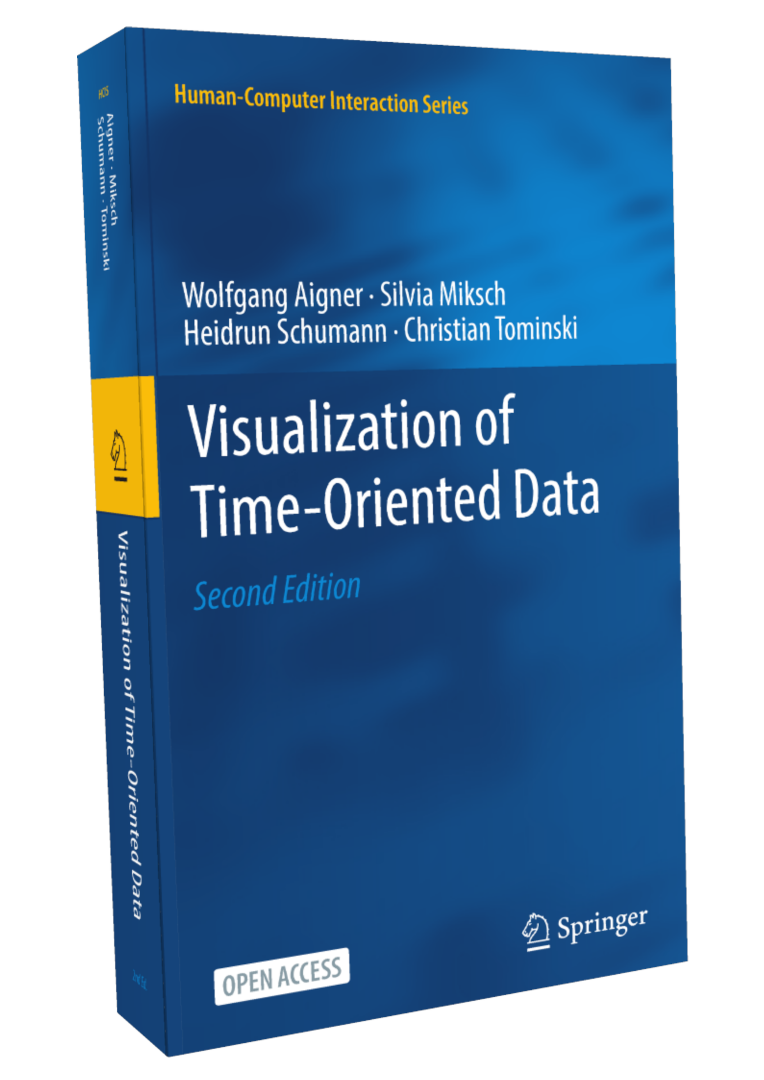
About the book
Time is an exceptional dimension with high relevance in medicine, engineering, business, science, biography, history, planning, or project management. Understanding time-oriented data via visual representations enables us to learn from the past in order to predict, plan, and build the future.
What, then, is time?
If no one asks me, I know what it is.
If I wish to explain it to them who ask, I do not know.
The book's second edition builds upon the great success of the first edition. It maintains a brief introduction to visualization and a review of historical time-oriented visual representations. At its core, the book develops a systematic view of the visualization of time-oriented data. Separate chapters discuss interaction techniques and computational methods for supporting the visual data analysis. Many examples and figures, like the one below, illustrate the introduced concepts and techniques.
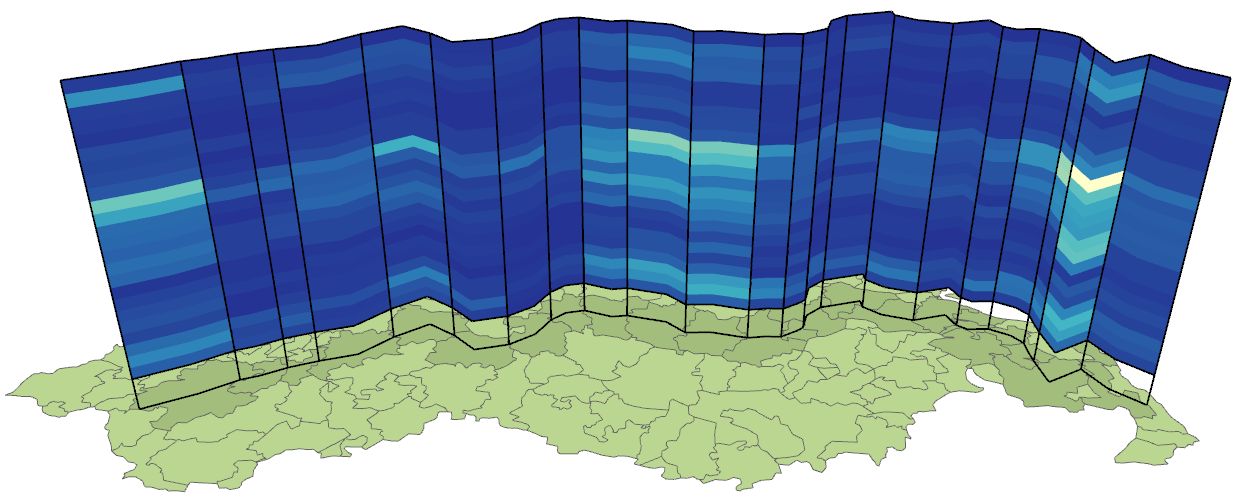
So, what is new for the second edition? First of all, the second edition is now published as an open-access book so that anyone interested in the visualization of time and time-oriented data can read it. Second, the entire content has been revised and expanded to represent state-of-the-art knowledge. The chapter on interaction support now includes advanced methods for interacting with visual representations of time-oriented data. The second edition also covers the topics of data quality as well as segmentation and labeling. The comprehensive survey of classic and contemporary visualization techniques now provides more than 150 self-contained descriptions accompanied by illustrations and corresponding references. A completely new chapter describes how the structured survey can be used for the guided selection of suitable visualization techniques.
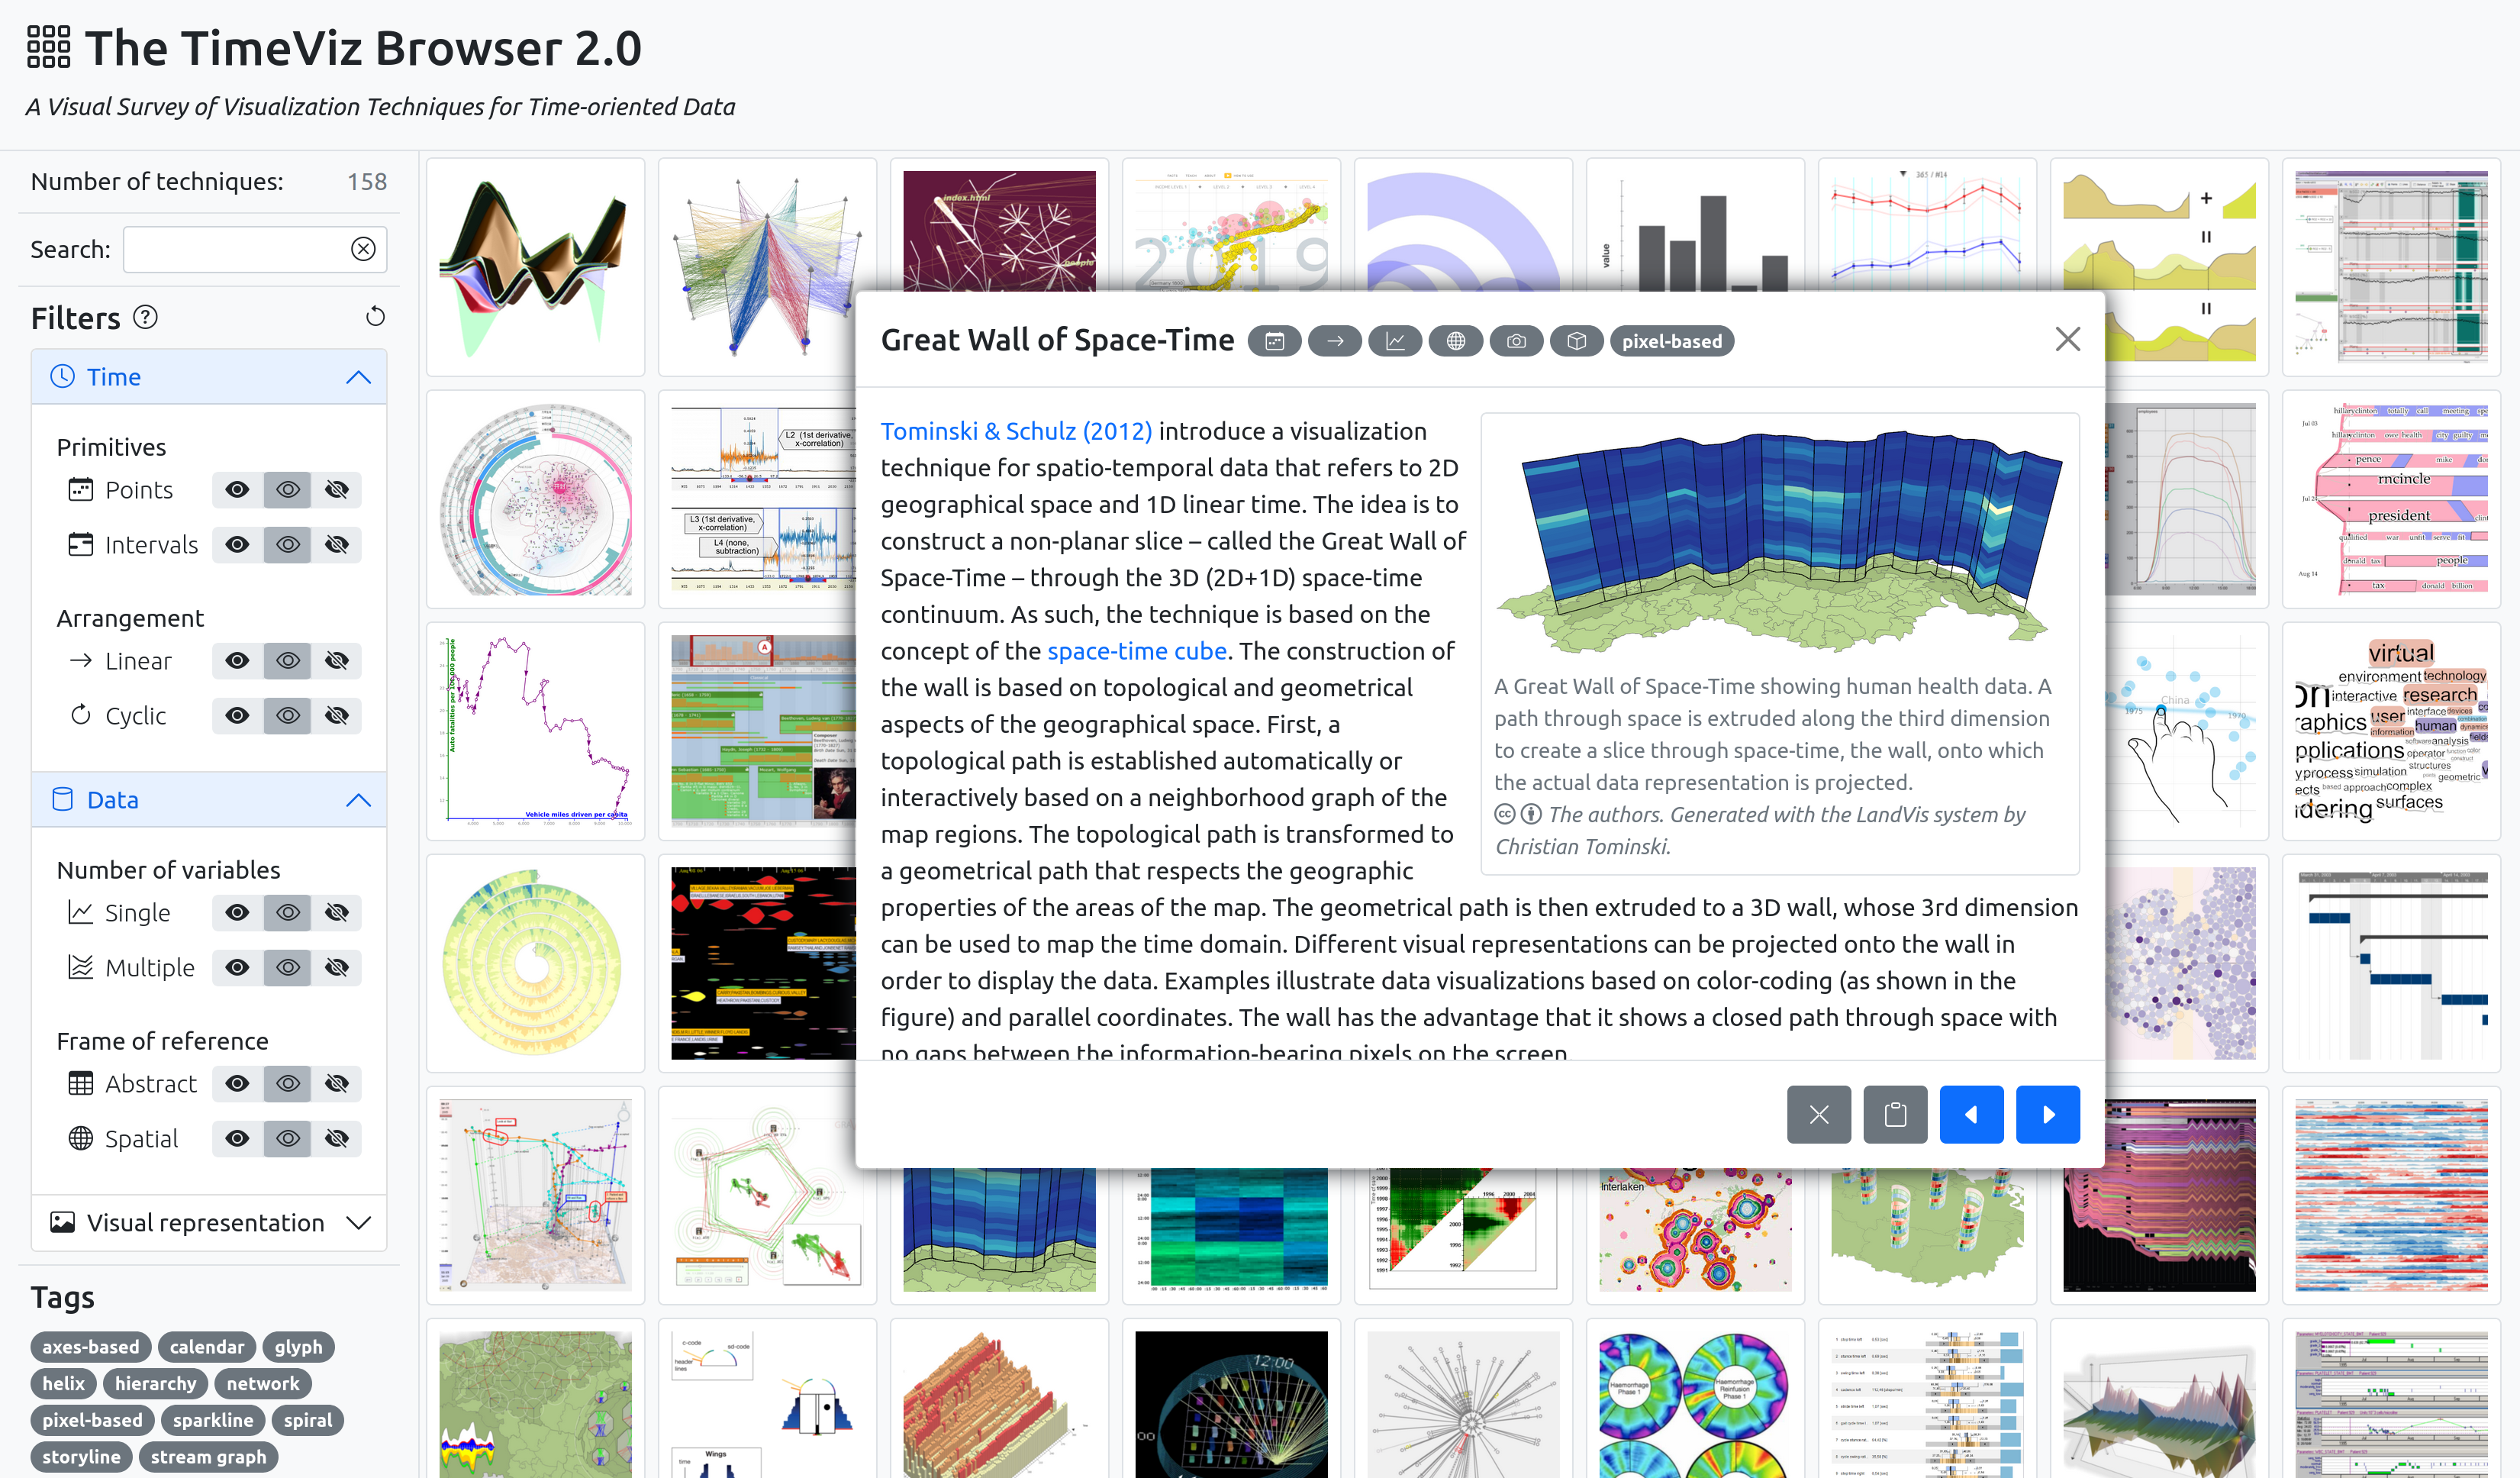
For the second edition, the TimeViz Browser, the digital pendant to the survey of visualization techniques, received a major upgrade. It includes the same set of techniques as the book, but comes with additional filter and search facilities allowing scientists and practitioners to find exactly the solutions they are interested in. The TimeViz Browser is available at https://browser.timeviz.net.
Highlights
- Systematic introduction to the state of the art in visualizing time and time-oriented data
- Coverage of interaction and computational methods to support the visual data analysis
- Structured survey of more than 150 classic and contemporary visualization techniques
Book contents
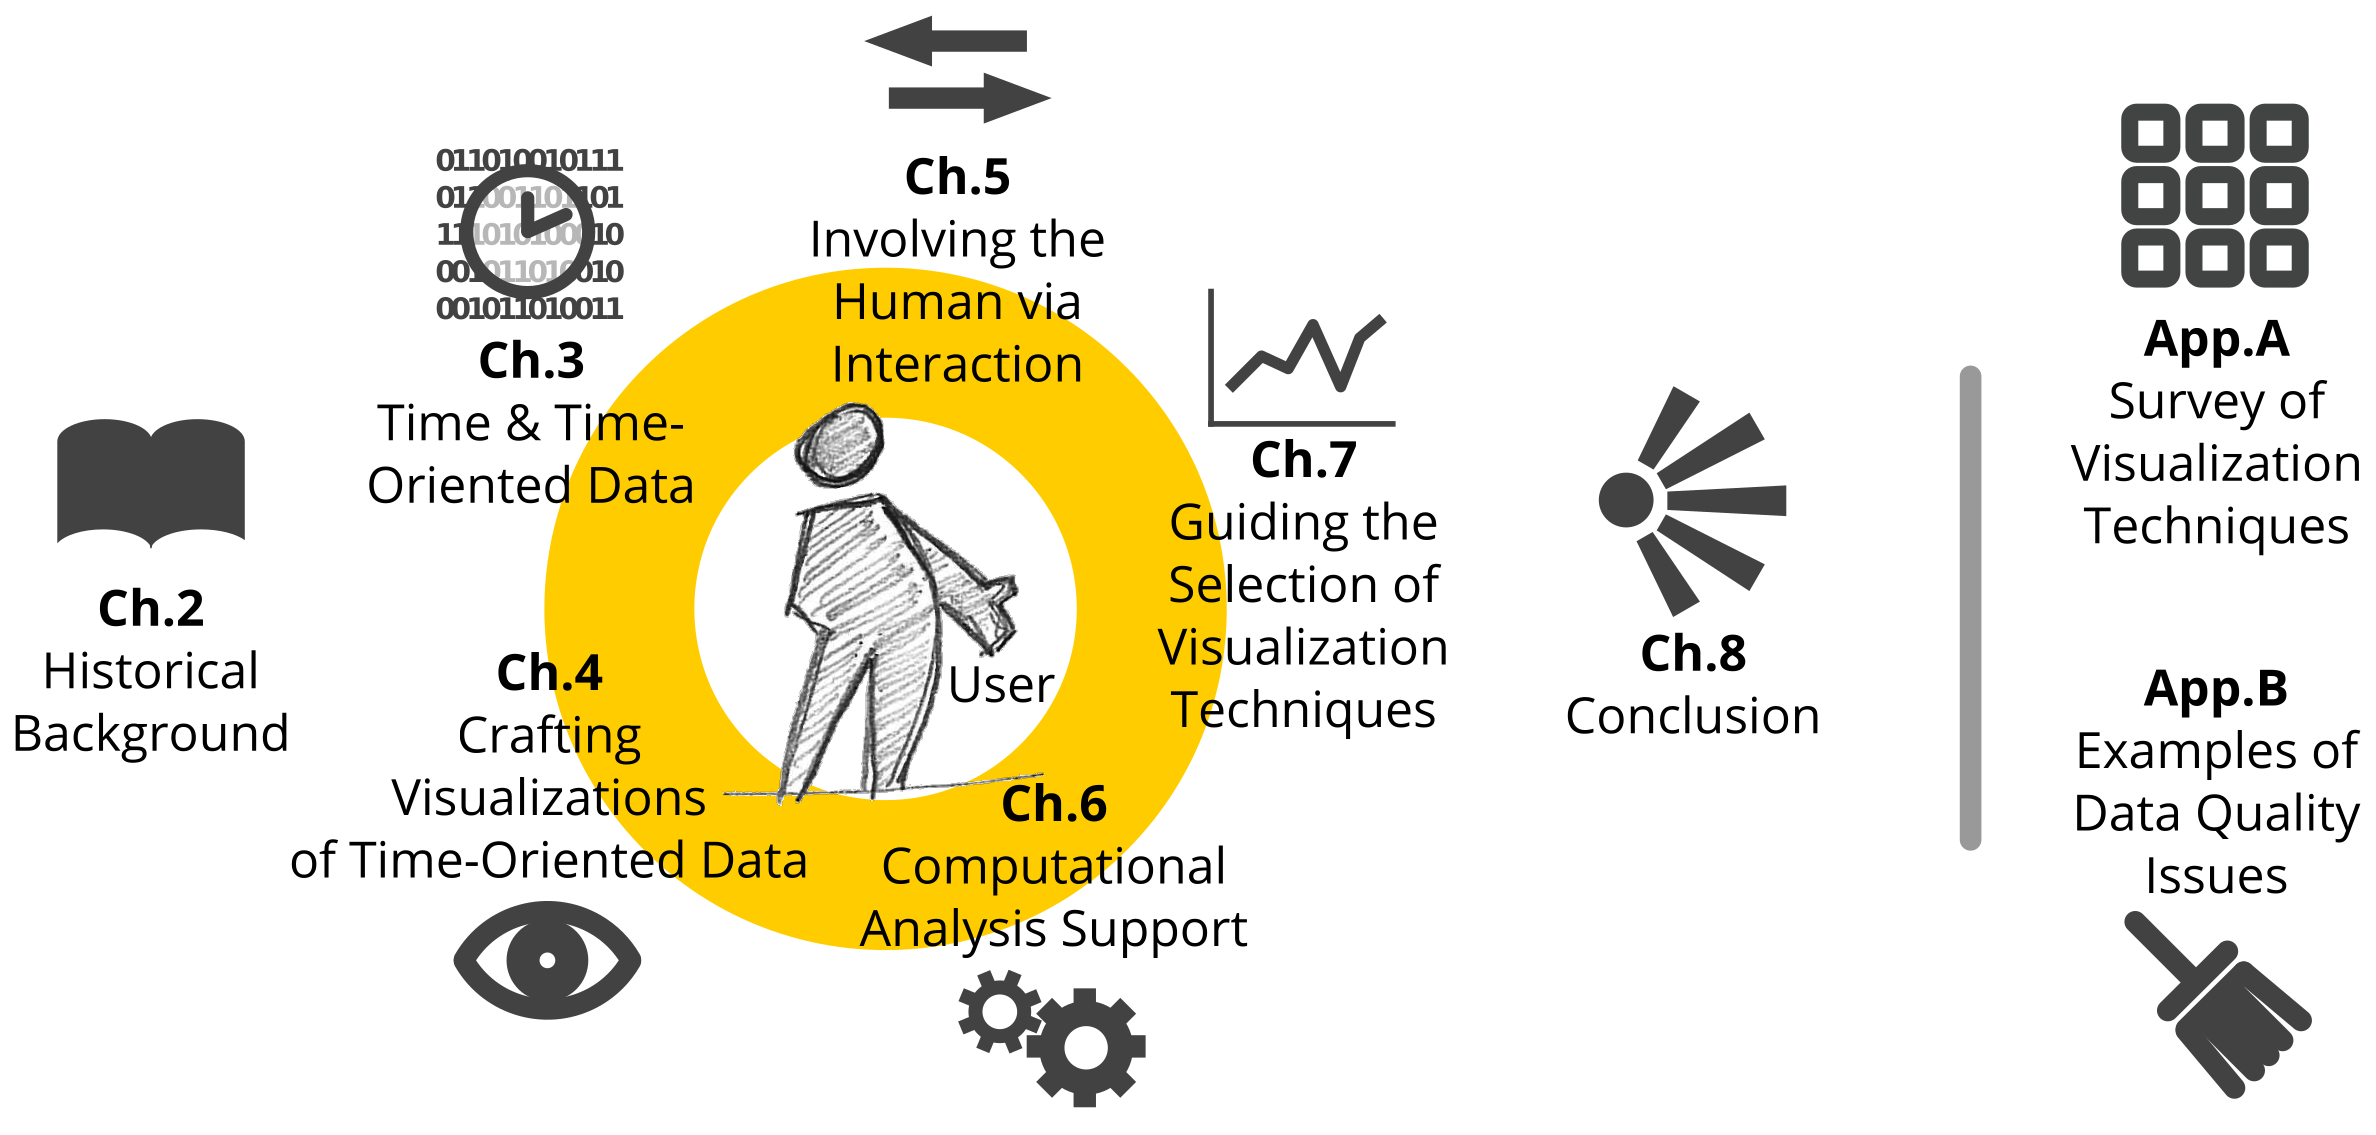
After a brief introduction in Chapter 1, some inspiring and thought-provoking historical depictions and images of time and time-oriented data from the arts are given attention in Chapter 2. The characteristics of time and data for modern interactive visualization on computers are the focus of Chapter 3. The actual visualization process, that is, the transformation of abstract data to visual representations, will be discussed in Chapter 4. Chapter 5 and Chapter 6 go beyond pure visualization methods and discuss cornerstones of interaction and computational analysis methods to support exploration and visual analysis. Chapter 7 addresses the question of how to select visualization techniques that are appropriate for an application problem at hand. A final summary along with a discussion of open challenges can be found in Chapter 8.
A large part of the book is devoted to a survey of existing visualization techniques for time and time-oriented data in Appendix A. The second Appendix B provides a list of concrete examples of data quality problems. The figure below provides a visual overview of the contents of the book. Further below is the full table of contents.
About the authors
As the first edition, the second edition of the book has been co-authored by a team of four authors from Germany and Austria. Wolfgang Aigner, Silvia Miksch, Heidrun Schumann, and Christian Tominski are experts in the fields of visualization, visual analytics, and human-data interaction. Below are more detailed information about the authors and their backgrounds.
 Wolfgang Aigner is a professor at the Institute of Creative\Media/Technologies at the St. Pölten University of Applied Sciences, Austria where he is responsible for the research area “Data Visualization”. He is also an adjunct professor at TU Wien, Austria where he received his habilitation in computer science for his work on “Interactive Visualization and Data Analysis: Visual Analytics with a Focus on Time” in 2013. Dr. Aigner is an expert in information visualization and visual analytics, particularly in the context of time-oriented data, where he has authored and co-authored more than 150 scientific publications. He served as program committee member and chair for various scientific conferences and acts as associate editor for scientific journals. He has received national awards for his research work, was awarded a Top Cited Article 2005–2010 from Pergamon/Elsevier, and received a best paper honorable mention at the IEEE Conference on Visual Analytics Science and Technology (VAST). Since 2002, Wolfgang has been involved in the acquisition and execution of a number of funded basic and applied research projects at the national and international levels.
 Silvia Miksch is a university professor and head of the research division "Visual Analytics" (CVAST), Institute of Visual Computing and Human-Centered Technology, TU Wien since 2015. She has been head of the Information and Knowledge Engineering research group, Institute of Software Technology & Interactive Systems, TU Wien from 1998 to 2015. From 2006 to 2010 she was university professor and head of the Department of Information and Knowledge Engineering (ike) at Danube University Krems, Austria. In April 2010 she established the awarded Laura Bassi Centre of Expertise for Visual Analytics Science and Technology (CVAST) funded by the Federal Ministry of Economy, Family and Youth of the Republic of Austria. Silvia has acquired, led, and has been involved in several national and international applied and basic research projects. She served as paper co-chair of several conferences including IEEE VAST 2010, 2011, and 2020 and overall papers chair IEEE VIS 2021 as well as EuroVis 2012, and on the editorial board of several journals including IEEE TVCG and CGF. She acts on various strategic committees, such as the VAST and EuroVis steering committees as well as the VIS executive committee. In 2020, she was inducted into the IEEE Visualization Academy. Furthermore, she acts as scientific reporter in the board of the Austrian Research Fund (FwF) and is advisory board member of the Vienna Science and Technology Fund (WWTF). She has more than 300 scientific publications and her main research interests are visualization and visual analytics over time and space with particular focus on interaction techniques, network-based, knowledge-assisted, and guidance-enriched methods.
 Heidrun Schumann is a professor emeritus at the University of Rostock, Germany, where she was heading the Chair of Computer Graphics at the Institute for Visual & Analytic Computing. She received doctoral degree (Dr.-Ing.) in 1981 and post-doctoral degree (Dr.-Ing. habil.) in 1989. Her research and teaching activities cover a variety of topics related to computer graphics, including information visualization, visual analytics, and rendering. She is interested in visualizing complex data in space and time, combining visualization and terrain rendering, and facilitating visual data analysis with progressive methods. A key focus of Heidrun's work is to intertwine visual, analytic, and interactive methods for making sense of data. Heidrun published more than two hundred articles in top venues and journals. She co-authored the first German textbook on data visualization, a textbook specifically on the visualization of time-oriented data, and a textbook on interactive visual data analysis. In 2014, Heidrun was inducted as a Fellow of the Eurographics Association. In 2020, she was awarded with the Fraunhofer Medal. In the same year, she was inducted to the IEEE Visualization Academy.
 Christian Tominski is a professor at the Institute for Visual & Analytic Computing at the University of Rostock, Germany. He received doctoral (Dr.-Ing.) and post-doctoral (Dr.-Ing. habil.) degrees in 2006 and 2015, respectively. In 2021, he was granted the title of professor (apl. Prof.) for human-data interaction. His main research interests are in visualization of and interaction with data. He is particularly interested in effective and efficient visual analytics techniques for interactively exploring, analyzing, and editing complex data. Christian has published numerous papers on new visualization and interaction techniques for multivariate data, temporal data, geo-spatial data, and graph data. In his work, he emphasizes conceptual aspects and aims to systematically investigate visual analytics challenges. He co-authored three books, including a book on the visualization of time-oriented data, a book focusing on interaction for visualization, and a more general book about interactive visual data analysis. Christian is the maintainer of several visual analytics systems and visualization tools, including the LandVis system for spatio-temporal health data, the VisAxes tool for time-oriented data, the CGV system for coordinated graph visualization, the Responsive Matrix Cells for exploring and editing multivariate graphs, and the TimeViz Browser for visualization techniques for time-oriented data.
Open access
You can access and download the PDF of the entire book or individual chapters for free. If you make use of the book contents, please, give an appropriate attribution, preferably by citing the book using the bibliographic information provided below.
The open access was made possible by financial support from the Institute for Visual & Analytic Computing at the University of Rostock, the Institute of Creative\Media/Technologies at the Fachhochschule St. Pölten, and the Institute of Visual Computing and Human-Centered Technology at TU Wien.
Official publisher information
The official information about the book can be found at Springer Link.
Book download
Download the entire book including the front matter, all chapters and appendices, and the back matter.
- Complete book PDF
Chapter download
Download individual parts of the book. Chapter downloads are forwarded directly to Springer. For the appendices and the back matter, we provide our own PDF files.
Front Matter
- Foreword by Ben Shneiderman
- Preface
- About the Authors
- Acknowledgements
1. Introduction
- Introduction to Visualization
- Application Example: Electronic Health Record Visualization
- Book Outline
- References
2. Historical Background
- Classic Ways of Graphing Time
- Time in Visual Storytelling & Arts
- Summary
- References
3. Time & Time-Oriented Data
- Modeling Time
- Characterizing Data
- Relating Data & Time
- Considering Data Quality
- Summary
- References
4. Crafting Visualizations of Time-Oriented Data
- Characterization of the Visualization Problem
- Visualization Design Examples
- Summary
- References
5. Involving the Human via Interaction
- Motivation & User Intents
- Interaction Fundamentals
- Basic Interaction with Time-Oriented Data
- Advanced Interaction Methods
- Summary
- References
6. Computational Analysis Support
- Temporal Analysis Tasks
- Principles of Temporal Data Abstraction
- Classification via Segmentation and Labeling
- Clustering Time Series
- Principal Component Analysis for Time-Oriented Data
- Summary
- References
7. Guiding the Selection of Visualization Techniques
- Structuring the Space of Solutions
- The TimeViz Browser
- Overview of Visualization Techniques
- Guided Search for Visualization Techniques
- Summary
- References
8. Conclusion
- Book Summary
- Practical Concerns
- From Visualization to Visual Analytics
- Future Research Opportunities
- References
A. Survey of Visualization Techniques
- List of Techniques
- Techniques for Abstract Time-Oriented Data
- Techniques Supporting a Spatial Frame of Reference
B. Examples of Data Quality Issues
- Single-Source Problems
- Multi-Source Problems
- Summary
Back Matter
- References
- Index
License regulations
The book is an open access publication. It is licensed under the terms of the Creative Commons Attribution 4.0 International License (https://creativecommons.org/licenses/by/4.0/), which permits use, sharing, adaptation, distribution, and reproduction in any medium or format, as long as you give appropriate credit to the original author(s) and the source, provide a link to the Creative Commons license and indicate if changes were made.
Most of the figures in the book are included in the book's Creative Commons license. Yet, some figures are not, which is indicated in the figure captions. If material is not included in the Creative Commons license and your intended use is not permitted by statutory regulation or exceeds the permitted use, you will need to obtain permission directly from the indicated copyright holder.
Bibliographic information
                @Book{Aigner23TimeViz2nd,

                  author = {Aigner, Wolfgang and Miksch, Silvia and Schumann, Heidrun and Tominski, Christian},

                  publisher = {Springer},

                  title = {{Visualization of Time-Oriented Data}},

                  year = {2023},

                  edition = {Second Edition},

                  doi = {10.1007/978-1-4471-7527-8},

                  isbn = {978-1-4471-7527-8},

                  url = {https://timeviz.net},

                }
Errata
Please, report any mistakes in the book to book@timeviz.net.
- p. 167 and 430, Reference Tominski and Schumann (2008): The given URL is no longer valid. The following URL can be used instead: https://ep.liu.se/ecp/034/013/ecp083413.pdf.
The TimeViz Browser 2.0
Do you have problems finding visualization techniques that match your particular needs? A tool that can help you mitigate this problem is the TimeViz Browser. It enables you to explore, investigate, and compare more than 150 visualization techniques for time-oriented data. The TimeViz Browser employs a simplified categorization schema to tag and structure the visualization techniques, which makes it easier to explore the space of solutions. The TimeViz Browser is freely available at https://browser.timeviz.net.
Contact
If you like the book or found a mistake reach out to one of the authors or email to book@timeviz.net.
Wolfgang Aigner
Institute of Creative\Media/Technologies
St. Pölten University of Applied Sciences
St. Pölten, Austria
Silvia Miksch
Institute of Visual Computing and Human-Centered Technology
TU Wien
Vienna, Austria
Heidrun Schumann and Christian Tominski
Institute for Visual & Analytic Computing
University of Rostock
Rostock, Germany
